Imperitrade is proud to announce that is now has a charting system in place for your stock analysis. You can get to the stock graphs by requesting a quote on Imperitrade.
As an example, here is the Imperial Stock Exchange chart in real time (3 month chart):
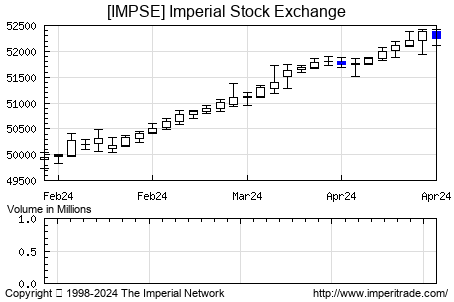 http://charts.imperitrade.com/exchange/IMPSE/days/90/
These charts will only show the previous history of the stocks and exchanges. The current day prices will not be reflected on the charts until the following day.
As a quick lesson (this is also true in the real market charts), the stock charts being displayed are called candlestick graphs. Some of you may be familiar with that. Each entry on the graph is a candlestick which is either filled in or left open.
The filled in candlesticks mean that the closing price for that entry is lower than the opening price (downtrend). The opposite is true for the open candlesticks, where the close price is higher than the open price (uptrend).
Only the box (filled or open) part of the candlestick show you the opening and closing prices of the stock. When there is an extra line above or below the box, that means the stock was higher or lower than the opening and closing prices respectively.
As you can see in the IMPSE exchange, we've been in a downtrend for the past few months. There are some entries that have some wide swings (higher and/or lower values than the box), but still end up opening and closing around the same price.
You also have the option of putting these stock charts right onto your web pages. The charts will always be dynamically updated, so all you'll need to do is use one of the following image sources in your image tag.
Stock Charts
http://charts.imperitrade.com/stock/IMC/
http://charts.imperitrade.com/stock/IMC/days/30/
http://charts.imperitrade.com/stock/IMC/mindsp/1/
http://charts.imperitrade.com/stock/IMC/days/90/mindsp/1/
Exchange Charts
http://charts.imperitrade.com/exchange/IMPSE/days/90/
http://charts.imperitrade.com/exchange/IMPSE/mindsp/1/
All you need to do is substitute the stock or exchange symbol with the correct symbol and it will generate the chart for you. The default number of days to display is 30 and the valid entry for the days has to be 30 or more (90=3m, 365=1y, etc). To be sure you have your image right, you can view it directly in the browser by going to the chart address.
If you just want a summary chart that shows a smaller chart with minimal information, you'll want to include an extra '
mindsp/1/' value to the end of the stock chart image. It will look like this:
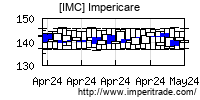 http://charts.imperitrade.com/stock/IMC/mindsp/1/
If you have any questions, go ahead and post them up in this ComNet thread. Enjoy!
 -----------------------
Grand Moff Kadann, Dark Lord
Head of the Vast Empire High Council
HHC/GM Kadann/HC-1/mSSD Atrus {EE}{MoH}{TT}{SY4}